One of the processes in data science is data visualization, which asserts that after data has been gathered, reused, and modeled, it must be represented in order to draw conclusions. Data visualization is part of the larger field of data presentation architecture (DPA), which strives to find, locate, modify, format, and transmit data in a clear, concise, and efficient manner.
What is Data Visualization?
It is the practice of placing information into a visual framework, such as a map or graph, to make data easier for the human brain to understand and draw conclusions from. The main thing of data visualization is to make it easier to see patterns, trends, and outliers in large data sets. Statistics plates, information visualization, and information tiers are all expressions that are occasionally used interchangeably.
The capability to perceive data is pivotal for virtually every career. Preceptors may use it to show test results for scholars, and computer scientists can use it to enhance artificial intelligence( AI), and directors can use it to communicate with stakeholders. It’s pivotal to big data systems as well. Businesses needed a way to fluently acquire an overview of their data as they gathered enormous amounts of data in the early times of the big data trend.
For similar reasons, visualization is essential to advanced analytics. It becomes crucial to see the outputs when a data scientist is writing advanced predictive analytics or machine learning (ML) algorithms in order to track outcomes and make sure that models are operating as planned.
Why is data visualization important?
Using visual data, data visualization offers a rapid and efficient approach to convey information to all audiences. Also, the practice can help businesses in determining the variables that impact consumer behavior, relating areas that bear enhancement or fresh attention, making data more memorable for stakeholders, figuring out the times and locales to vend particular products, and deals.
Data visualization also offers the following advantages:
- An increased perception of the consecutive steps involved must be figured out to improve the organization.
- An improved ability to hold an audience’s interest with information they can understand.
- An easy distribution of information compiled to increase the opportunity to share insights with the team.
Visualization of data is the capacity to take in information quickly, improve insights, and make decisions more quickly.
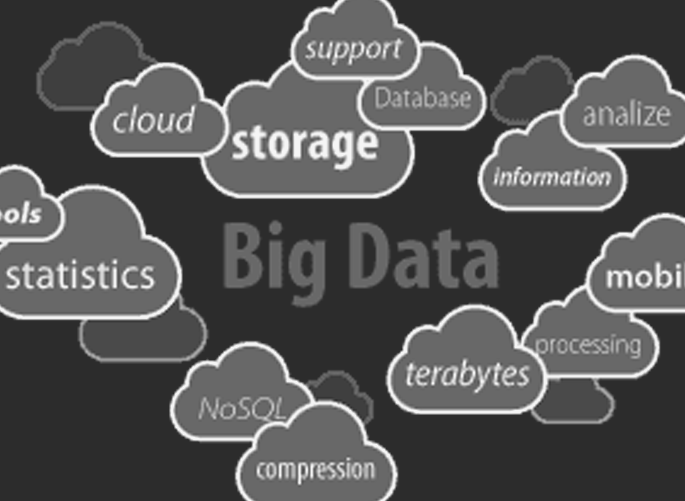
Data Visualization and Big Data
The increased fashionability of big data and data analysis systems have made visualization more important than ever. Companies are decreasingly using machine literacy to gather massive quantities of data that can be delicate and slow to sort through, comprehend and explain. Data visualization tools offer a means to speed this up and present information to business possessors and stakeholders in ways they can understand.
Big data visualization frequently goes beyond the typical ways used in normal visualization, similar as pie maps, histograms and commercial graphs. It rather uses more complex representations, similar to heat charts and fever maps.
Big data visualization requires important computer systems to collect raw data, process it and turn it into graphical representations that humans can use to draw conclusions.
Big data visualization requires important computer systems to collect raw data, process it and turn it into graphical representations that humans can use to draw conclusions. While big data visualization can be salutary, it can pose several disadvantages to associations.
They are as follows:
To utilize big data visualization tools to their full potential, a visualization specialist has to work on it. This specialist must be suitable to identify the data sets and visualization styles to guarantee associations are optimizing the use of their data.
Big data visualization systems frequently bear involvement from IT, as well as operation, since the visualization of big data requires important computer tackle mechanisms, and effective storehouse systems.
The operability of big data visualization works only as accurate as the information being projected. Thus, it’s essential to have people and processes in place to govern and control the quality of commercial data, metadata and data sources. Big data visualization can only yield perceptivity that is as accurate as the data being displayed.
As a result, it is crucial to have systems in place for managing and regulating the quality of corporate data, metadata, and data sources.
Data visualization examples
The most popular visualization system was turning data into a table, bar graph, or pie map using a Microsoft Excel spreadsheet. Although traditional visualization approaches are still constantly employed, more sophisticated types are now also available, similar as the following
- Infographics
- Bullet lists
- Fever map
- A heat map
- Charts of time series
Conclusion
Data visualization tools are increasingly being used as front ends for more complex big data environments as data visualization companies expand the capability of these tools. Data engineers and scientists can use data visualization tools to maintain track of data sources and do simple exploratory analysis on data sets before or after more in-depth advanced analysis.